Is the union of the chinese dragon with the african lion nothing but a chimera?
Part 1: CHINESE INVESTMENT IN AFRICA: WHAT CHARACTERISTICS?
Summary:
– China began to invest in African countries in the 80s, however, since the year 2000, China’s investment in Africa has been growing more rapidly.
– The lion’s share of Chinese FDI in Africa goes to the natural resource sector, but there is more and more diversification in the recent years (in manufacturing, finance…). Furthermore, Chinese enterprises have helped the establishment of an upstream-downstream-integrated industry chain in many African countries, thus transforming resource advantages into economic growth opportunities.
– However, FDI is just one aspect of China’s “going out” strategy. China uses hybrid forms of financing tools, thus blurring the classical distinction between aid and FDI.

During the last decade, Africa has experienced tremendous economic transformation. The continent has attracted new investments and projects and developed growing economic ties with emerging partners. Among them, China’s increasing interest with Africa has generated considerable debates among scholars and journalists both in developed and developing countries. However, China’s interest in Africa is not new. China began to invest in African countries in the 1980s, principally with firms coming from Taiwan and Hong Kong. Since the beginning of the decade, when Beijing started promoting its “going out” policy and with the creation of the Forum for China-Africa Cooperation, firms from the Chinese mainland joined them which increased significantly Chinese investment. But what are the characteristics of Chinese investment in Africa? And is the Chinese investment really different from other foreign investment in Africa?
Preamble – Caveats when dealing with FDI data
The most widely used definitions for Foreign Direct Investment are those of the International Monetary Fund (IMF) and the Organisation for Economic Co-operation and Development(OECD). According tothe Balance of Payments Manual Fifth Edition (IMF), FDI refers to “an investment made to acquire lasting interest in enterprises operating outside of the economy of the investor. Further, in cases of FDI, the investor´s purpose is to gain an effective voice in the management of the enterprise. The foreign entity or group of associated entities that makes the investment is termed the « direct investor« . The unincorporated or incorporated enterprise a branch or subsidiary, respectively, in which direct investment is made – is referred to as a « direct investment enterprise ». Some degree of equity ownership is almost always considered to be associated with an effective voice in the management of an enterprise; the BPM5 suggests a threshold of 10 per cent of equity ownership to qualify an investor as a foreign direct investor”. The OECD gives a similar definition :“a direct investment enterprise is an incorporated or unincorporated enterprise in which a single foreign investor either owns 10 per cent or more of the ordinary shares or voting power of an enterprise (unless it can be proven that the 10 per cent ownership does not allow the investor an effective voice in the management) or owns less than 10 per cent of the ordinary shares or voting power of an enterprise, yet still maintains an effective voice in management. An effective voice in management only implies that direct investors are able to influence the management of an enterprise and does not imply that they have absolute control. The most important characteristic of FDI, which distinguishes it from foreign portfolio investment, is that it is undertaken with the intention of exercising control over an enterprise” (Detailed Benchmark Definition of Foreign Direct Investment: Third Edition).
FDI is a central indicator in economy, yet difficult to measure precisely. As these definitions emphasize, the notion of control is quite subjective and the minimum of 10 per cent ownership is a suggestion of how to qualify the ability of the investor to have an influence on the management of the enterprise rather than a strict requirement. For example, in the United Kingdom, a stake of 20 per cent or more was a threshold until 1997. Some countries do not specify a threshold point, but rely entirely on other evidence, including companies´ own assessments as to whether the investing company has an effective voice in the foreign firm in which it has an equity stake.
It is important to note that assembling a reliable database on FDI in Africa is challenging, particularly for FDI from China. There are large discrepancies between the different sources that are hard to explain as it is difficult to access the complete methodology used by each country. For instance, according to the Central Bank of Egypt, in 2009 the Chinese investment is $60 million, but according to Chineseministry of foreign commerce (MOFCOM) data, the Chinese investment in 2009 is $133.86 million. Similarly, in Nigeria in 2007 according to Nigeria the Chinese investment is $43.4 million and according to MOFCOM it is $390.35 million, in Uganda in 2009 according to Uganda it is $265.9 million and according to MOFCOM it is $1.29 million. Differences also exist between national sources and UNCTAD [1]. For instance, in Morocco, in 2009, the total foreign investment according to the Central Bank is $21907.1 million whereas according to UNCTAD it is $6086.73 million.
According to UNCTAD (2013), in the World Investment Report 2013, “the large discrepancy with data from the Ministry of Commerce, which reports FDI data to UNCTAD, reflects differences in the compilation methodology of the two Government agencies.”
One possible explanation of these discrepancies could also be the fact that FDI is quite complex to measure. Firms have many channels by which to finance their affiliates’ activities, some will be captured by official Balance of Payment statistics while others probably not. There are three components of FDI: equity capital, reinvested earnings and other capital (mainly intra-company loans). As countries do not always collect data for each of those components, reported data on FDI are often not fully comparable across countries.
In order to overcome known data weaknesses, we will use different sources and when possible compare them. For FDI data the most used source is UNCTAD, which publishes each year the World Investment Report and gives access to an online database. However, there are large gaps in the data reported and UNCTAD does not provide a country or sector breakdown for FDI in Africa. Analyses of the national data for some African countries on the one hand, and of the Chinese reported investment in Africa on the other hand, supplement the lack of data. Finally, an analysis of the articles of the press allows us to better understand some investment deals and the way they are conceived. The information from press article should nevertheless be seen with extreme caution as headline FDI numbers published on Chinese investment are usually exaggerated. These announcements cover intention to invest but the investment can be cancelled or modified substantially. Also one should be aware when analysing data on individual countries is that very large amount of FDI flows goes to some offshore financial centres and may be rerouted from there to Africa. Finally, because China often uses complex financial packages, it is hard to disentangle FDI from aid and suppliers’ contracts.
1. Global trends
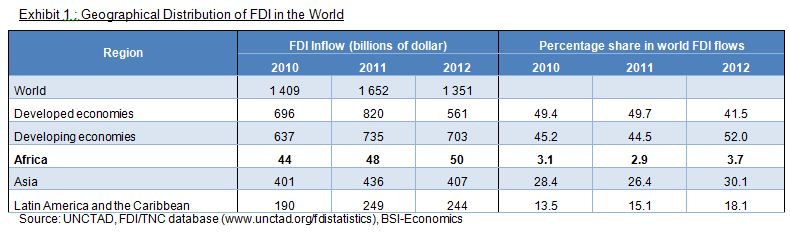
FDI inflows into Africa declined from $72 billion in 2008 to $50 billion in 2012. The share of Africa remains the lowest in the world, but FDI flows are still much higher than at the beginning of the century when Africa’s share was below 1%. This is a sign that investment conditions are improving in Africa and governments are creating a more business-friendly environment.Interestingly enough, Africa is the only region that saw a rise of FDI inflows in 2012 (Exhibit 1). According to UNCTAD (2013) flows to North Africa reversed their downward trend, and FDI inflows directed to sub-Saharan Africa were driven partly by investments in the extractive sector in countries such as Congo DR, Mauritania, Mozambique or Uganda. In the recent years, investor confidence seems to have returned to North Africa, as FDI flows rose by 35 % in 2012. With an increase from $9.1 billion in 2000 to $50 billion in 2012, FDI has become a major source of finance for Africa’s development.
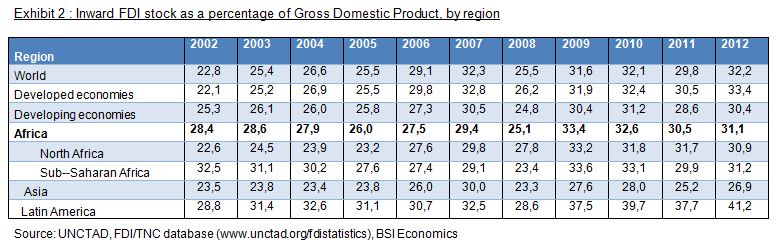
However, FDI in absolute value does not provide complete information. FDI flows as a percentage of Gross Domestic Product (GDP) allows us to take into account the market size of the recipient country as well as to measure the degree of integration//dependency in the global economy. By comparing the inward FDI stocks as a percentage of GDP across different regions in Exhibit 2, it appears that Africa is not left behind but, on the contrary, above average (UNCTAD data, 2013).The stock of FDI [2] is a better measure of the ‘transfer of new ideas and technologies’ than flows. Once scaled by the market size, the ratio is higher for Africa than for the average of the developing or developed economies (ODI 2010). Interestingly enough, with this measure, countries like Liberia (558 % in 2012), Congo (167%) and even Africa as a whole (31%) received more than China (10.3%). (UNCTAD data, 2013) This also shows that the private sector in Africa relies heavily on foreign investment and can be a sign that the most urgent matter for policy makers is not so much to attract more investment but rather to stimulate local investment and make the most of the existing Foreign Direct Investment.
China and Africa have a longstanding partnership as China began to invest in African countries in the 80s -on a small scale at the beginning – and kept expanding its investment scale since then. Since 2000, China’s investment in Africa has been growing even more rapidly, thanks to the creation of the Forum on China-Africa Cooperation (FOCAC) (According to the China Economic and Trade Cooperation White Paper, 2010).
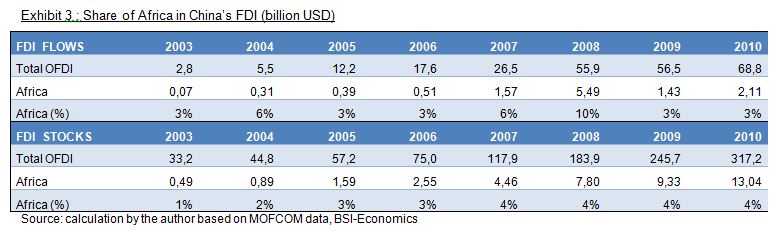
Africa still represents a small part of Chinese FDI stocks (4% in 2009), and between 3 and 10% of Chinese FDI outflows. However, a significant part of Chinese investment is goingto platforms that are not the final destination. Hong Kong for instance represented 63% of the total FDI outflows from China in 2009. The Heritage Foundation, an American think-tank, created the Chinese Investment tracker. They estimate that in 2005-10 about 14% of China’s investment abroad goes to Sub-Saharan Africa as a final destination.
According to the China Economic and Trade Cooperation White Paper recently published in August 2013, from 2009 to
2012, China’s FDI in Africa increased from $1.4 billion to $2.5 billion, with an annual growth rate of 20.5%. Over 2,000 Chinese firms are investing in more than 50 African countries and regions, and cooperation fields have expanded from agriculture, mining and building industry to intensive processing of resource products, industrial manufacturing, finance, commercial logistics and real estate. Indeed, the rapid industrial upgrading currently taking place in China provides opportunities for African countries to attract more Chinese FDI in the manufacturing sector (PEOPLE’S REPUBLIC OF CHINA, 2013). The World Investment Report 2013 (UNCTAD, 2013) estimates Chinese FDI stock in Africa at $16 billion in 2011. According to UNCTAD data, South Africa is the leading recipient of Chinese FDI in the continent, followed by the Sudan, Nigeria, Zambia and Algeria.
The Chinese government plays an active role in encouraging Chinese enterprises expanding their investment in Africa, as part of the “going out » [3] strategy. According to China Economic and Trade Cooperation White Paper, by the end of 2012, China has signed bilateral investment treaties with 32 African countries[4], and established joint economic commission mechanisms with 45 African countries.
2. Main African Recipients
One important feature of FDI to Africa is that it is concentrated in a few host countries. For instance, in 2010 Angola received $7.9 billion, which represents 15% of all FDI to Africa in that year. Egypt and Nigeria follow with $6.8 and $4.5 billion respectively. For regional aggregates, North Africa is the top destination for FDI with 30% and 50% of all FDI flows to Africa since 2004. Central Africa has been the second FDI destination and Angola is the biggest FDI recipient in the sub-region, accounting for almost 60% of FDI to the region. Western Africa comes third with 20% of FDI to Africa, 50% of which are destined to Nigeria. Southern Africa received about 11% of FDI to African countries over the last five years, with South Africa accounting for 85% of it during 2007‑09. Eastern Africa has the lowest share of FDI to African countries (8%) and, except for Uganda, the countries in the region do not have natural resources which might explain why they attract less investment. (African Economic Outlook 2010)
China’s FDI to Africa follows the same trend : in terms of country distribution, it is also quite concentrated. In 2009 China’s top 5 FDI destinations in Africa (i.e. South Africa, Nigeria, Zambia, Algeria, and Sudan) accounted for almost 60% of all Chinese OFDI stocks in Africa (MOFCOM). Based on OECD data, the 10 topmost African recipient of OECD countries’ investment are South Africa, Egypt, Nigeria, Morocco, Algeria, Congo, Libya, Mauritius, Tunisia and Ghana. For China, an analysis of the MOFCOM data shows that the topmost recipients also include South Africa, Egypt, Algeria, Mauritius and Nigeria but, in contrast, include Zambia, Sudan, Democratic Republic of Congo, Ethiopia, Tanzania, Madagascar and Guinea. As the African Economic Outlook 2010 underlines it, China is present in a broad range of countries, especially countries that usually attract few external financial resources like East African countries. For instance, Ethiopia represents almost the same stock of Chinese FDI in 2009 (USD 283 billion) than Egypt (USD 285 billion) which is the second FDI destination of OECD members countries in Africa and one of the top recipients of FDI in the continent. This can be due to the fact that the market of these countries is easier to penetrate, whereas in countries like Egypt the traditional partners already have a strong network and leave less room for Chinese investors.
It is interesting to note that 85% of all FDI from OECD countries to Africa goes to 15 oil-exporting countries[5]. Despite the increasing amount of FDI to Africa over the last ten years, this ratio has been very stable. By analysing the data from MOFCOM, we find that the oil exporting countries represent 76% of the total FDI stock in Africa, thereby going against the idea that Chinese investments are most resource seeking than those of other countries.
Another common criticism of Chinese engagement in Africa is that it is mainly present in “rogue” states, like Sudan or Zimbabwe. In that sense, the Wikileaks [6] cables provide an interesting insight, with quotes from the American Ambassador Carson during his visit to Nigeria saying: “The Chinese are dealing with the Mugabe’s and Bashir’s of the world” and from the U.S. State Department’s top Africa expert who believes that China is a “pernicious economic competitor” with “no morals” in its African dealings. However, as shown in the analysis of the destinations of Chinese investment, the reality is more complex. If Chinese companies invest in Sudan’s oil sector, it does not represent the largest stock of China’s foreign investment on the continent and the main destinations of Chinese FDI are relatively well-governed and stable countries, like South Africa. Moreover, China began to cooperate more actively with Western countries to solve human rights abuses. For instance they sent special envoys that were able to convince Sudan to allow a hybrid force of UN and African Union peacekeeping troops into Darfur. In practice, we find indeed no evidence of deteriorating governance scores in African countries with a strong Chinese engagement. For instance, a closer look at the evolution the Corruption Perception Index [7] in countries with strong Chinese engagement does not lead to the conclusion that China has had a negative effect on governance performance in Africa. The corruption Perception Index of Algeria went from 2,6 in 2003 to 3,4 in 2012[8], and the same evolution is observed in Nigeria (1,4 in 2003 and 2,7 in 2012) and Zambia (2,5 and 3,7). South Africa remains stable (4,4 and 4,3).
3. Investors in Africa
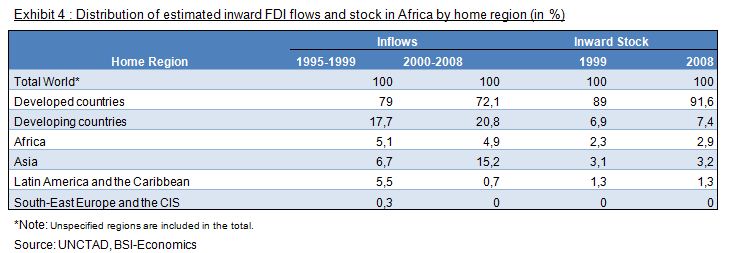
Many observers believe that Chinese companies now dominate African economies; however rigorous analysis of data reveals the major investors in Africa are still from developed countries – especially the United States and the European Union. As shown in the Exhibit 4, they account for the main share of FDI flows and stock in Africa. However the emerging partners’ share is growing rapidly, and for instance, while in 2000 the developing countries accounted for only 23.7% of the total number of international joint venture in Africa, in 2009 they accounted for 44.7% (UNCTAD).
Press headlines are such that most people are keenly aware that China is becoming a feature of the African landscape. One very interesting aspect of China’s presence in Africa is that its behaviour and discourse operated an image shift regarding the continent. The perception by Western countries and Africans themselves is that Chinese see Africa no more as a “hopeless continent” – as The Economist [9] put it at the beginning of the decade- but as a continent full of opportunities for investment. The demonstration effect of China is even beginning to affect the attitude of Western countries, reviving their interest for the continent. After the Chinese dragon and the Indian tiger, the World Bank is now talking about the “African Lions” and McKinsey Global Institute released a report entitled “Lions on the Move”, showing the change of the continent’s image. The McKinsey Global Institute points out that “By 2040, the continent will be home to one in five of the planet’s young people, and the size of its labor force will top China’s. Companies already operating in Africa should consider expanding. For others still on the sidelines, early entry into emerging economies provides opportunities to create markets, establish brands, shape industry structures, influence customer preferences, and establish long-term relationships”. Thus Africa attracts investment not only for its rich natural resources but also as one of the last market to conquer. Indeed, FDI flows oriented directly to the African consumer are rising as investors in Africa are becoming more and more aware of the positive demographic outlook for the continent (UNCTAD 2013).
What is less clear is whether it is possible to assess the magnitude of China’s investment in Africa. In the Exhibit 4, the share of Asia is the most important for developing countries, with 15.2%, however this category cannot be directly associated with China as it also includes India and all the Middle East, who also are major investors in Africa. Indeed, an analysis of the national accounts for FDI shows that the share of China in total FDI inflows to Africa is quite low in the countries studied. The countries of the Middle East have a significant share (although separately their share is smaller than China’s). They are mostly present in North Africa, which is the most important African region in terms of FDI. By analysing more in detail the countries in this group, it appears that it is mainly the United Arab Emirates, Saudi Arabia and Kuwait. India is also one of the biggest investor in Africa. Indian investment has traditionally been concentrated in Mauritius – however the final destination of these investments is often elsewhere- and it is only quite recently that India started investing in Côte d’Ivoire, Senegal and Sudan.

Note: The table was constructed using data from all countries where data were available in both periods: Morocco, Djibouti,Republic of Congo, Gabon, Tanzania, Mauritius, Malawi, Nigeria, Rwanda and Uganda.
Source: African Economic Outlook 2010, BSI-Economics
However, according to UNCTAD, China rank second in the top 5 of developing economy investors in Africa in 2006-2008 with $2,528 billion, just after South Africa ($ 2,5 billion), and before Malaysia ($ 0,6 billion ) India ($ 0,3 billion) and Chinese Taipei ($ 0,05 billion).
The share of China in the local data seems quite low compared to the data provided in the press and in the World Investment Report 2010 (although the time periods are not exactly the same so the two datasets cannot be directly compared). These differences have many explanations. First, the countries for which the data was accessible in the national accounts are not those where China is most present, as shown in the analysis of the geographical distribution of China’s FDI in Africa, so the share of China is most certainly underestimated in the Exhibit 4. However, it cannot be excluded that importance of China as an investor in Africa is also sometimes overestimated. Many supposedly gigantic Chinese deals are based on disinformation and spread by the media and it is often difficult to separate myths from reality. For instance, in one of its articles, The Economist writes “For investment in African farming, China has earmarked $5 billion” echoing back a Liberian press report which said that “The Chinese government recently announced a commitment of US$5bn for Chinese corporations to invest in African agriculture over the next 50 years through the new China–Africa Development Fund” (The Economist, 2011). However it appears that $5bn is the figure for the ultimate intended size of the entire fund, not to be reached until several years. The equity fund is destined to all sectors and very little of its investment has gone to agriculture. The Heritage Foundation’s China Global Investment Tracker shows that a number of deals have failed to materialize in sub-Saharan Africa and many investments have been brokered by the China-Africa Development Fund, especially in Nigeria.
4. Sectoral distribution
Data on sectoral breakdown of FDI flows and stocks to Africa are very incomplete, but by looking at FDI destinations in Africa it is possible to make the hypothesis that a large proportion of FDI goes to the oil sector. The World Bank (2010) estimates that in most African countries between 50 and 80% of FDI go to natural-resource exploitation, however some countries are also able to attract FDI into the other sectors such as telecommunications, construction, banking and light manufacturing. For instance, according to UNCTAD, in 2009 the service sector attracted the largest share of cross-border M&A in Africa (however this is mainly due to a 2.4 billion Vodafone deal in South Africa).
The lion’s share of Chinese FDI in Africa goes to the natural resource sector, but there is more and more diversification in the recent years (IMF 2011). In absolute terms Chinese investment is concentrated on natural resources, but the largest number of projects is undertaken in manufacturing and infrastructure (UNCTAD 2011). The reason is that in China there is a marked dichotomy between the FDI operations of large-state owned companies and privately owned Small and Medium Enterprises (IMF 2011): large-state owned firms focuse mainly on resource-extraction and infrastructure and the SMEs concentrate more in the manufacturing and service industries. In addition to resource-seeking motives, China also invests in Africa in order to create markets for their products and services; partly because of the increased competition Chinese companies are facing in their domestic market. A survey among Chinese private investors indicates that their investment is “emphatically market-driven” (Gu, 2009). With the liberalization reforms of the financial sector in many countries, the investment of Chinese companies in finance has risen rapidly. For example, in 2007 the Industrial and Commercial Bank of China (ICBC) purchased 20 percent of Standard Bank of South Africa for $5.5 billion. Significant investments have also been made in manufacturing, fisheries electric power, ports, tourism, agribusiness, water systems, and waste management (UNCTAD, 2011).
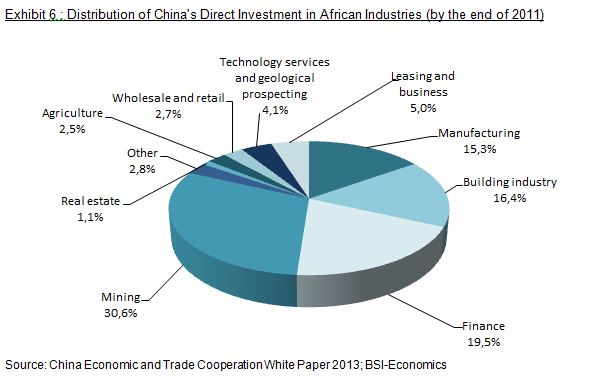
The China Economic and Trade Cooperation White Paper (2013) provide a sectoral distribution of the Chinese investment in Africa at the end of the year 2011. It appears that energy and mineral resource exploitation remains the major part of Chinese investment in the region. However, the report stresses that Chinese enterprises have helped the establishment of an upstream-downstream-integrated industry chain in many African countries, thus transforming resource advantages into economic growth opportunities. For instance, in the Democratic Republic of the Congo, Chinese enterprises have built highways, hospitals and other public infrastructure while extracting copper-cobalt ores. Another key Chinese investment field in Africa is the manufacturing sector. By the end of 2012, China’s investment in Africa’s manufacturing industry is estimated, by the China Economic and Trade Cooperation White Paper, to $3.43 billion. Chinese enterprises also invest in finance, trade, science and technology services. China’s direct investment in Africa’s financial sector reachs $3.9 billion by the end of 2012. (PEOPLE’S REPUBLIC OF CHINA, 2013)
5. New modalities supporting the Chinese investment
As part of its “going out” strategy, China uses alternative financing modes that transcend the classical definition of FDI and
official development assistance. These hybrid financing instruments are a mix of trade, investment and development assistance. They cannot be classified as Foreign Direct Investment but rather represent tools used by China to support its investment policy (Brautigam 2010b). This is all the more important as almost 20% of firms identify access to finance as the biggest obstacle faced in Sub-Saharan Africa (enterprise survey database World Bank). Dahman Saidi and Wolf (2011) give an analyse of these new financial modalities:
Natural resource-backed lines of credit:
These are loans usually issued on non-concessional rates, where the ExIm Bank issues lines of credit for the finance of infrastructure projects in recipient countries that are natural resource backed: in some cases natural resource exports used as securityto pay back the loan, in other cases Chinese company gains preferential access to a block of natural resources. Serving to as credits for investment and trade, they nevertheless constitute an important instrument for development. (Brautigam 2010b) So far in the following African countries have been negotiating this type of finance with: Congo-Brazzaville (2001, Imboulou hydroelectric dam), Nigeria (2002), Angola (2004, 2007), Equatorial Guinea (2006), Ghana (2007, Bui Dam), DRC (2008, mining Joint Venture), Sudan (various years). In the DRC for example, negotiated in 2007 a USD 6 billion loan (initially USD 9 billion) which is secured by a newly created Chinese-Congolese mining Joint Venture of which the Chinese hold 68% of the shares. The loan is paid back through the export of minerals. The civil engineering contracts with Chinese firms paid through these funds are used for the construction of large scale infrastructure projects (e.g. 6000 km roads to connect Kinshasa to the East, 3000km railways etc), hospitals, schools, social housing. Another well-known example is the case of Angola which received two ExIm Bank credit lines of USD 2 bn (2004) and 2,5 bn USD (2007), which are to be repaid in commodities, for the construction of 1,300 km of railways and 300 km of roads in Angola, as well hospitals, schools, social housing, telecommunications network and investment in agriculture. (Brautigam 2010a). However, analysis shows that China’s past oil-backed lines of credit have been slow to disburse. In Angola, only $2.5 billion had been spent in 2009 from the $4.5 billion commitment. Repayments for the loans have been made through direct shipments of oil valued at the “prevailing market price”.
Export credits:
Aiming at supporting national exporters in their competing for overseas sales, Chinese export credits are subsidised and modestly concessional (22% – 37%) loans. (Brautigam 2010a) The sum of all export credits by DAC members between 2004 and 2008 averaged USD 4.2 billion, of which less than USD 500 million annually were disbursed to Africa. By contrast, in 2009 China disbursed a total of USD 29.6 billion of export credit.[10]Brautigam (2010b) estimates preferential export credits provided to Africa to be around USD 2 billion during 2007 and 2009. There are two types of export credit: Export Buyer’s Credit, which refers to the medium and long-term credit provided to foreign borrowers to finance their imports of Chinese products, technologies and services, and Export Seller’s Credit, which refers to loans provided to an exporter to finance its export of manufactured or purchased mechanical and electronic products, complete sets of equipment, and high- and new-tech products as well as the provision of labor services. Export credits are generally criticized by OECD countries as they go against the World Trade Organization recommendations. However, Chinese export credit seems to be also used by China as a tool to encourage investment rather than only supporting trade. According to China’s Exim Bank, the disbursement for Export Buyer Credit are $4.3 billion and for Export Seller Credit RMB 173.1 billion, and loan disbursement for overseas investment projects amounted to RMB 53.998 billion, 31 % of the total and the biggest share (loan disbursement for high-and new-tech products and for general mechanical and electronic products representing respectively 31 % and 9 %).
‘Mixed credits’:
Mixed credits represent another of “package financing” combining lines of export buyer’s credit (given to the borrowing country), export seller credits (issued to the Chinese company) and concessional loans. They are mostly issued for specific project. In 2006: ExIm Bank signs deals with Congo-Brazzaville, Ethiopia, Equatorial Guinea, Nigeria, Mauritania, Ghana, Namibia, Eritrea. (Brautigam, 2010a) In Nigeria for instance, a construction deal for three oil refineries and one petrochemical complex was announced in 2010 and financed with mixed credit. Once constructed the Chinese side would hold 80% of the shares.
Conclusion
There is no doubt that China is now a key partner of Africa. Chinese investment is present in almost all African countries and especially in some countries left over by western investors (like Ethiopia for instance) and even if Western countries still dominate the market, Chinese investment is growing rapidly. Chinese investment in Africa is encouraged by the Chinese government as part of its “going out” policy and Chinese firms can use and offer a vast range of hybrid financing instruments.
However, during many years western countries have invested in Africa and many projects have been criticized for being mainly directed to the oil extraction thus offering little positive impact for the development of the local economies or for being insufficiently maintained and inappropriate for the local economic conditions, especially in the infrastructure sector. Will history repeat itself or does the Chinese investment offers new opportunities for African Development?
References:
– BRAUTIGAM, D., (2010a). China, Africa and the international aid architecture. Working Paper No. 107. Tunis: African Development Bank Group.
– BRAUTIGAM, D., (2010b). Chinese Finance of Overseas Infrastructure. prepared for the OECD-IPRCC China-DAC Study Group. Paris: Organisation for Economic Cooperation and Development.
– DAHMAN SAIDI, M and C, WOLF, (2011). Recalibrating Development Cooperation: How Can African Countries Benefit from Emerging Partners? OECD Development Center Working Paper 302.
– EXPORT-IMPORT BANK, (2010). Annual Report for 2009. Beijing: The Export-Import Bank of China.
– GU, J (2009). China’s private enterprises in Africa and the implications for African development. European Journal of Development Research Special Issue. 21 (4).
– IMF, (2011). New Growth Drivers for Low-Income Countries: The Role of BRICs. Washington, D.C.: International Monetary Fund.
– OECD and AFDB, (2010). African Economic Outlook – Public ressource mobilisation and Aid. Paris: Organisation for Economic Cooperation and Development – Development Centre and African Development Bank.
– OECD and AFDB, (2011). African Economic Outlook – Africa and its Emerging Partnerships. Paris: Organisation for Economic Cooperation and Development – Development Centre and African Development Bank.
– PEOPLE’S REPUBLIC OF CHINA (2010). China-Africa Economic and Trade Cooperation, Information Office of the State Council, Beijing.
– PEOPLE’S REPUBLIC OF CHINA (2013). China-Africa Economic and Trade Cooperation, Information Office of the State Council, August 2013 Beijing.
– TE VELDE D.W. (2002),Foreign direct investment for development: Policy challenges for Sub-Saharan African countries. Overseas Development Institute (ODI), London
– THE ECONOMIST, (2010). Uncaging the Lions: Business is Transforming Africa for the Better. The Economist, June 12.
– THE ECONOMIST, (2011). Trying to pull together. The Economist, Apr 20th 2011.
– UNCTAD, (2001). World Investment Report 2001.Promoting Linkages. Geneva: United Nations Conference on Trade and Development (UNCTAD).
– UNCTAD, (2010a). South South Cooperation – Africa and the New Forms of Development Partnership. Economic Development in Africa Report 2010. Geneva: United Nations Conference on Trade and Development.
– UNCTAD, (2010b). World Investment Report 2010. Investing in a Low-carbon Economy. Geneva: United Nations Conference on Trade and Development (UNCTAD).
– UNCTAD, (2013). World Investment Report 2013.Global value chains: Investment and trade for development. Geneva: United Nations Conference on Trade and Development (UNCTAD).
Notes:
[1] United Nation Conference on Trade and Development
[2] “Flows of FDI comprise capital provided (either directly or through other related enterprises) by a foreign direct investor to an enterprise, or capital received from an investing enterprise by a foreign direct investor” “FDI stock is the value of the share of their capital and reserves (including retained profits) attributable to the parent enterprise, plus the net indebtedness of affiliates to the parent enterprise.”(World Investment Report 2007)
[3]Go Out policy(Zǒuchūqū Zhànlüè) is the People’s Republic of China’s current strategy to encourage its enterprises to invest overseas.
[4] Including Algeria, Benin, Botswana, Cape Verde, Chad, Congo, Congo DR, Côte d’Ivoire, Djibouti, Egypt, Equatorial Guinea, Ethiopia, Gabon, Ghana, Guinea, Kenya, Madagascar, Mali, Morocco, Mozambique, Namibia, Nigeria, Sierra Leone, South Africa, Sudan, Tunisia, Uganda, Zambia, Zimbabwei (UNCTAD data, 2013)
[5] The list of oil-exporting countries in Africa include : Algeria, Angola, Cameroon, Chad, Côte d’Ivoire, Republic of the Congo, Egypt, Equatorial Guinea, Gabon, Libya,Mauritania, Nigeria, South Africa, Sudan, Tunisia (OECD)
[6] WikiLeaks is an international non profit organization that publishes submissions of private, secret, and classified media from anonymous sources.
[7] The Corruption Perceptions Index (CPI) ranks countries and territories based on how corrupt their public sector is perceived to be. It is a composite index – a combination of polls – drawing on corruption-related data collected by a variety of reputable institutions. The CPI reflects the views of observers from around the world, including experts living and working in the countries and territories evaluated.
[8] Index (CPI) Score relates to perceptions of the degree of corruption as seen by business people and country analysts, and ranges between 10 (highly clean) and 0 (highly corrupt)
[9] In May 2000, the front page’s title of The Economist was “hopeless continent” above an image of an anonymous black man holding a weapon cropped in the shape of African map.
[10] Conversion from RMB to USD based on the official exchange rate provided by the World Bank’s WDI database.